Updates for EZLogic - 1.42.1 (Ezlo Hubs only)
Link: https://ezlogic.mios.com/
Previous: Updates for EZLogic - 1.41.1 (Ezlo Hubs only)
Device Settings. Device room management.
We applied changes to devices room management. By default, child devices follow parent device room and it was not possible to change their room. You saw the rooms dropdown on the device card, but when you tried to change the room you had no results.
In case if device does not have ability to have its own room we will display its current room name.
For the devices with an ability to have its own room, we will display rooms dropdown.
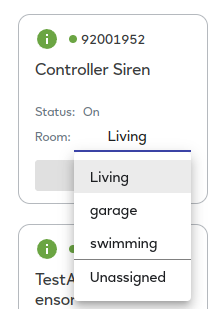
Note: some child devices could have its own room. It defined by manufacturer or plugin developer. That value exposed in device payload by “parentRoom” property. If “parentRoom”:false - it means that child device could be placed in its own room.
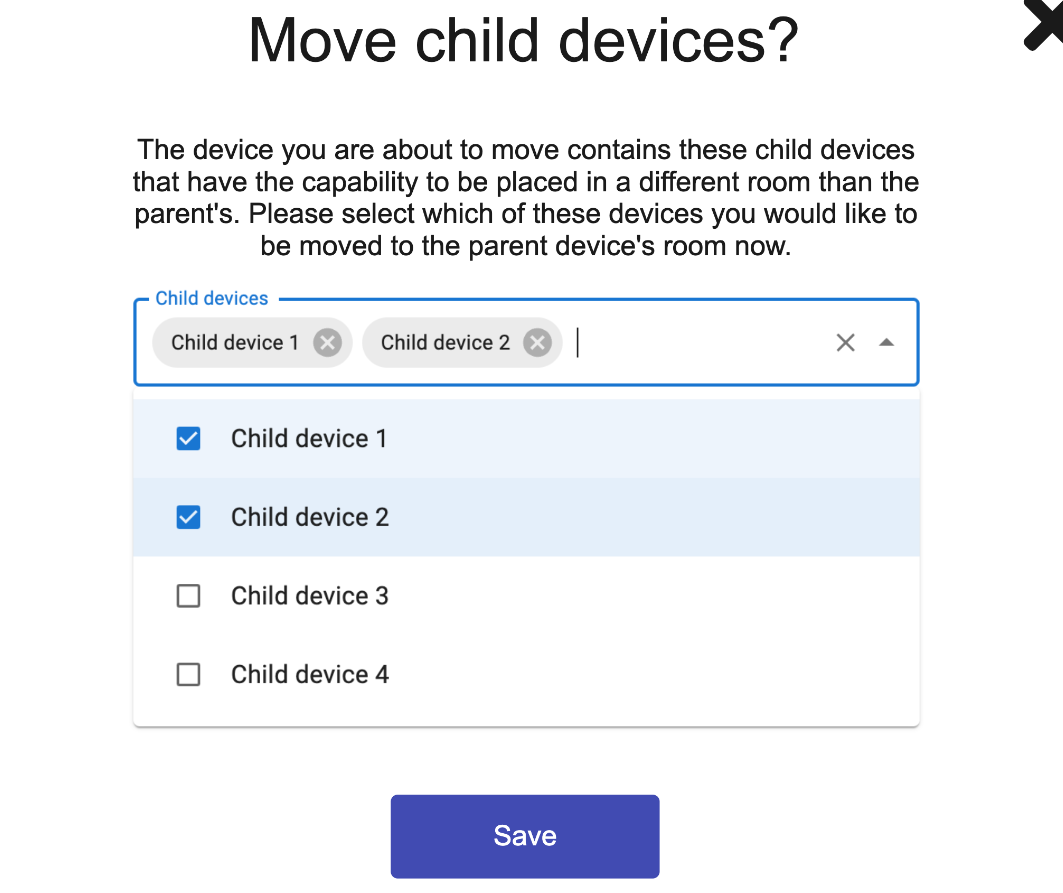
For parent devices, which have at least one child device with “parentRoom”:false, by clicking on new room in the dropdown we will show the dialog. Here you should decide, would you like to move your child devices to the same room as parent or leave them without changes.
Local MeshBot. Trigger. Local Variables.
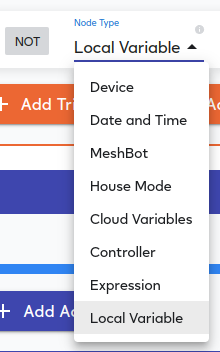
We added Local Variables node in trigger section. To use Local Variables as a left side comparator:
-
Select Local Variable node
-
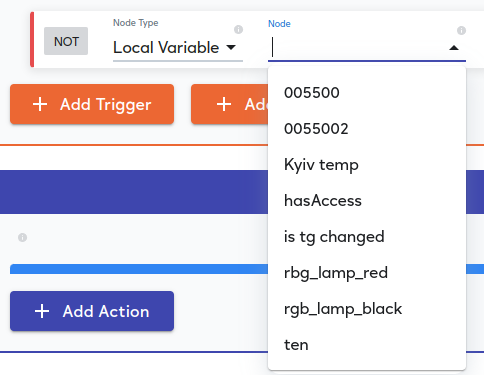
Select a Variable
-
Choose comparator
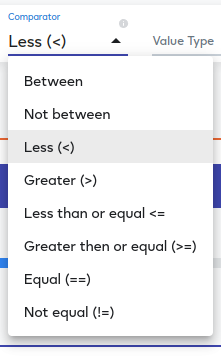
-
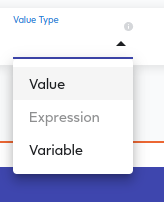
Select the value type you want to compare with
Note: it is possible to compare with Value or another Local Variable with the same type:
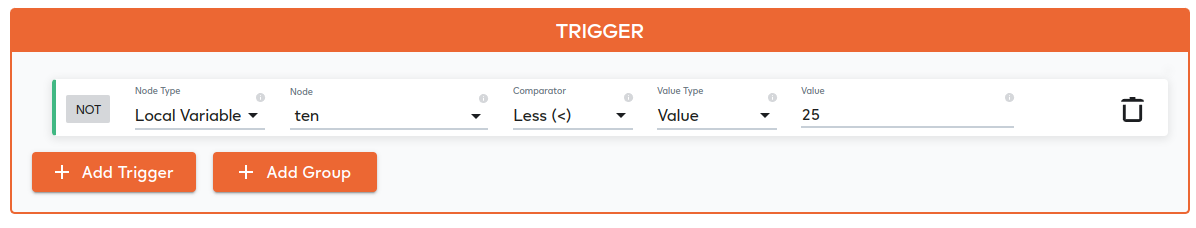
The full trigger could look like:
Example for color variable:
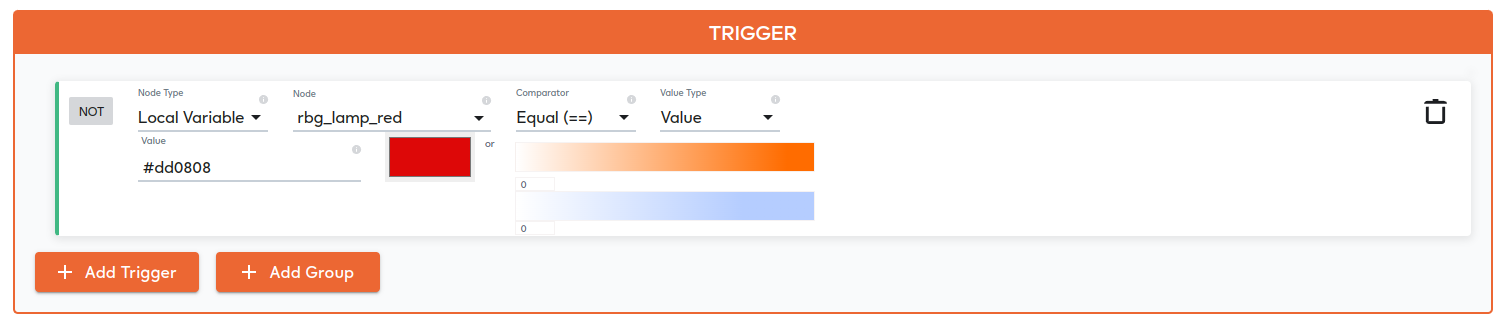
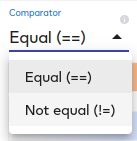
Note: Some variable types have different list of comparators. For example, color variables have “Equal” and “Not equal” comparators.
Fixes and Improvements:
- Fixed menu text field width on customization page.
- Fixed trigger nodes options in Cloud MeshBot.