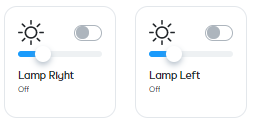
I’m starting this thread to discuss the new Ezlogic Web GUI default “Dynamic” Dashboard.
The concept is that out of the box the user will have a default automatically generated dashboard page (pages?) that can be used initially to get the user up and running quickly.
Obviously in addition, Ezlo are also developing the dashboard further, so it can be customised and so you can build your own dashboard pages and device tiles also etc.
If you want to create your own thread on this topic then that’s cool, but I thought maybe one main thread for users to report issues and feature requests might be a good idea.
Also don’t forget you should ideally also be creating ticket requests, on the Ezlo ticketing system here.
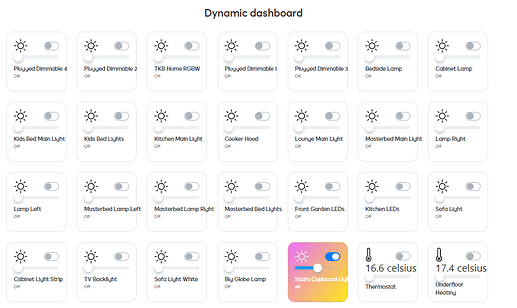
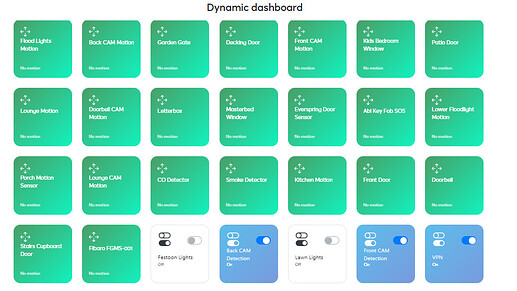
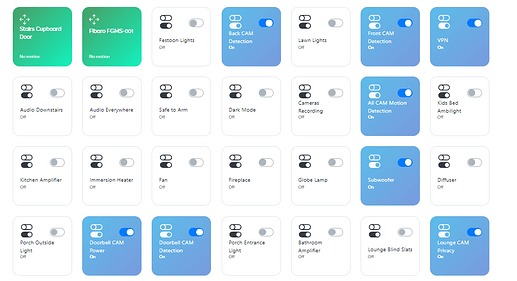
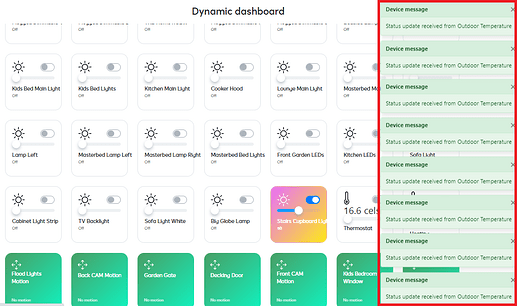
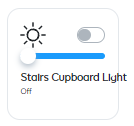
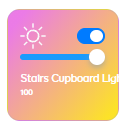
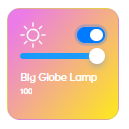
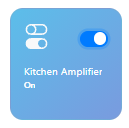
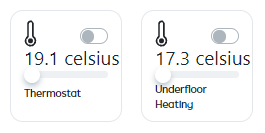
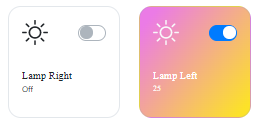
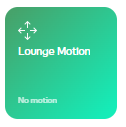
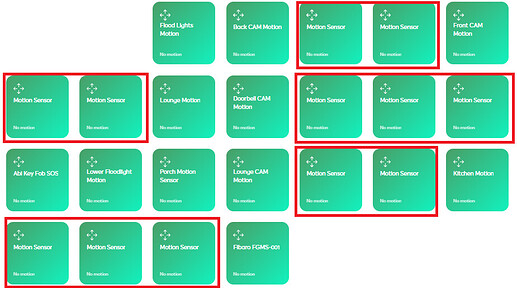
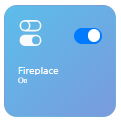
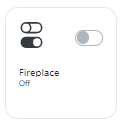
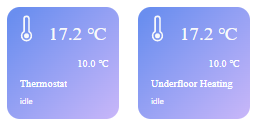
This is what I am seeing on my system so far, which is just one single dashboard page with the devices of device types - Dimmers, Switches, Temp Sensors, Contact and Motion Sensors, Smoke & Co Sensors.
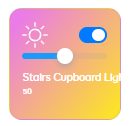
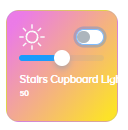
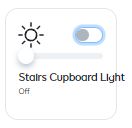
Not all of the tiles work or are operational currently. Some tiles do work like Dimmers and Switches however.
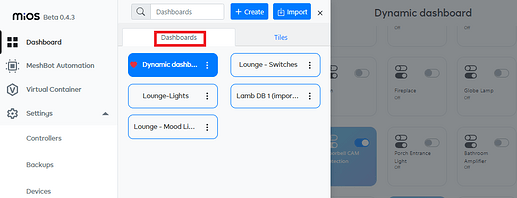
If you cannot see your “Dynamic” Dashboard page and its just blank, try switching to another dashboard page if you have one and then switching back to the Dynamic one, I have to do this every time currently to get the dynamic dashboard page to appear.
You may also find you get spammed with popup notification messages on the right hand side, these cannot currently be turned off.
