There’s been a problem with the service that pre-calculates the aggregations for hourly and daily graphs. It’s got overwhelmed with the amount of data and fallen behind. You may notice that some of the graphs aren’t showing all the data (raw data should be fine). The server needs upgrading to fix it which will mean taking it offline for a few minutes. This may stop your data coming through and you may need to restart the app. Apologies if that’s the case.
Versie 0.9 did change the behaviour a bit. Now I get this in the log (level 3), showing the error ‘Unable to form server request’:
| 50 | 03/17/21 16:55:49.119 | luup_log:300: DataSync: [3]command:curl -H ‘Content-Type: application/json’ -s https://webhooks.mongodb-realm.com/api/client/v2.0/app/constantgraph-iwfeg/service/http/incoming_webhook/data?apiKey=XXXXXXXXXXXXX -d ‘{app:vera/man,version:0.900,channels:[{id:1,v:1640,Name:Energiemeter - Watts,Device:31},{id:2,v:23.1,Name:Wasmachine - Watts,Device:196},{id:3,v:590.2474,Name:Wasmachine - KWH,Device:196}]}’ <0x2e77d680> |
|---|---|---|
| 50 | 03/17/21 16:55:49.251 | luup_log:300: DataSync: [2]response: <0x2e77d680> |
| 50 | 03/17/21 16:55:49.252 | luup_log:300: DataSync: [2]response not decoded. Payload:{app:vera/man,version:0.900,channels:[{id:1,v:1640,Name:Energiemeter - Watts,Device:31},{id:2,v:23.1,Name:Wasmachine - Watts,Device:196},{id:3,v:590.2474,Name:Wasmachine - KWH,Device:196}]} <0x2e77d680> |
| 50 | 03/17/21 16:55:49.255 | luup_log:300: DataSync: [2]Going into restricted mode: Unable to form server request. Check logs. <0x2e77d680> |
| 50 | 03/17/21 16:55:49.256 | luup_log:300: DataSync: [3]calling checkEnabled with a wait of 30 <0x2e77d680> |
Did you install both the .js and .lua files from the zip file above? You should now have a new option in the app on the ConstantGraph tab which says “Disable certificate check (may help with connection difficulties on older boxes)”. Can you check that box and see what happens? Thanks.
@jouked Also, I presume that the original log file had quotes around the variable names like {“Id”:1,“v”:“1640”… and the forum post stripped them out? Or did it really have no quotes in?
I uploaded the .js and .lua file in one go and didn’t check if that worked. So now I uploaded the .js file, the option was there, disabled the cert check and… succes! Data is received correctly by mongodb!
YAY! Great team work! Thanks for your help. I’ve submitted that fix for the app store.
As well as the switch to make the app work on older Vera boxes, the latest version of the app (0.910 when it’s approved) also includes CurrentSetpoint variables in the basic tab (thanks for the suggestion) and some fixes to stop the app crashing in certain circumstances. The data API now also accepts GET requests to submit data as well as POST (again thanks for the suggestion). I’ve also had a number of suggestions by email, keep them coming in and I’ll do my best to implement them.
I’ve updated the app increase the number of retries in case of a network issue. To install before it is published on the app store, download the attached file unzip and upload the two files into Vera > Apps > Develop Apps > Luup Files > Upload.DataSync.zip (9.2 KB)
Thanks to everyone who has contacted me via email with suggestions and bug fixes. The site can now deal with multiple controllers if you have more than one Vera box - ideal for comparing data from multiple sources. Additional controllers are not available on the basic subscription but let me know by email if you want a free upgrade to try it out.
If you had difficulty generating an API key recently the problem has now been resolved - it was to do with the release of the multiple controllers functionality.
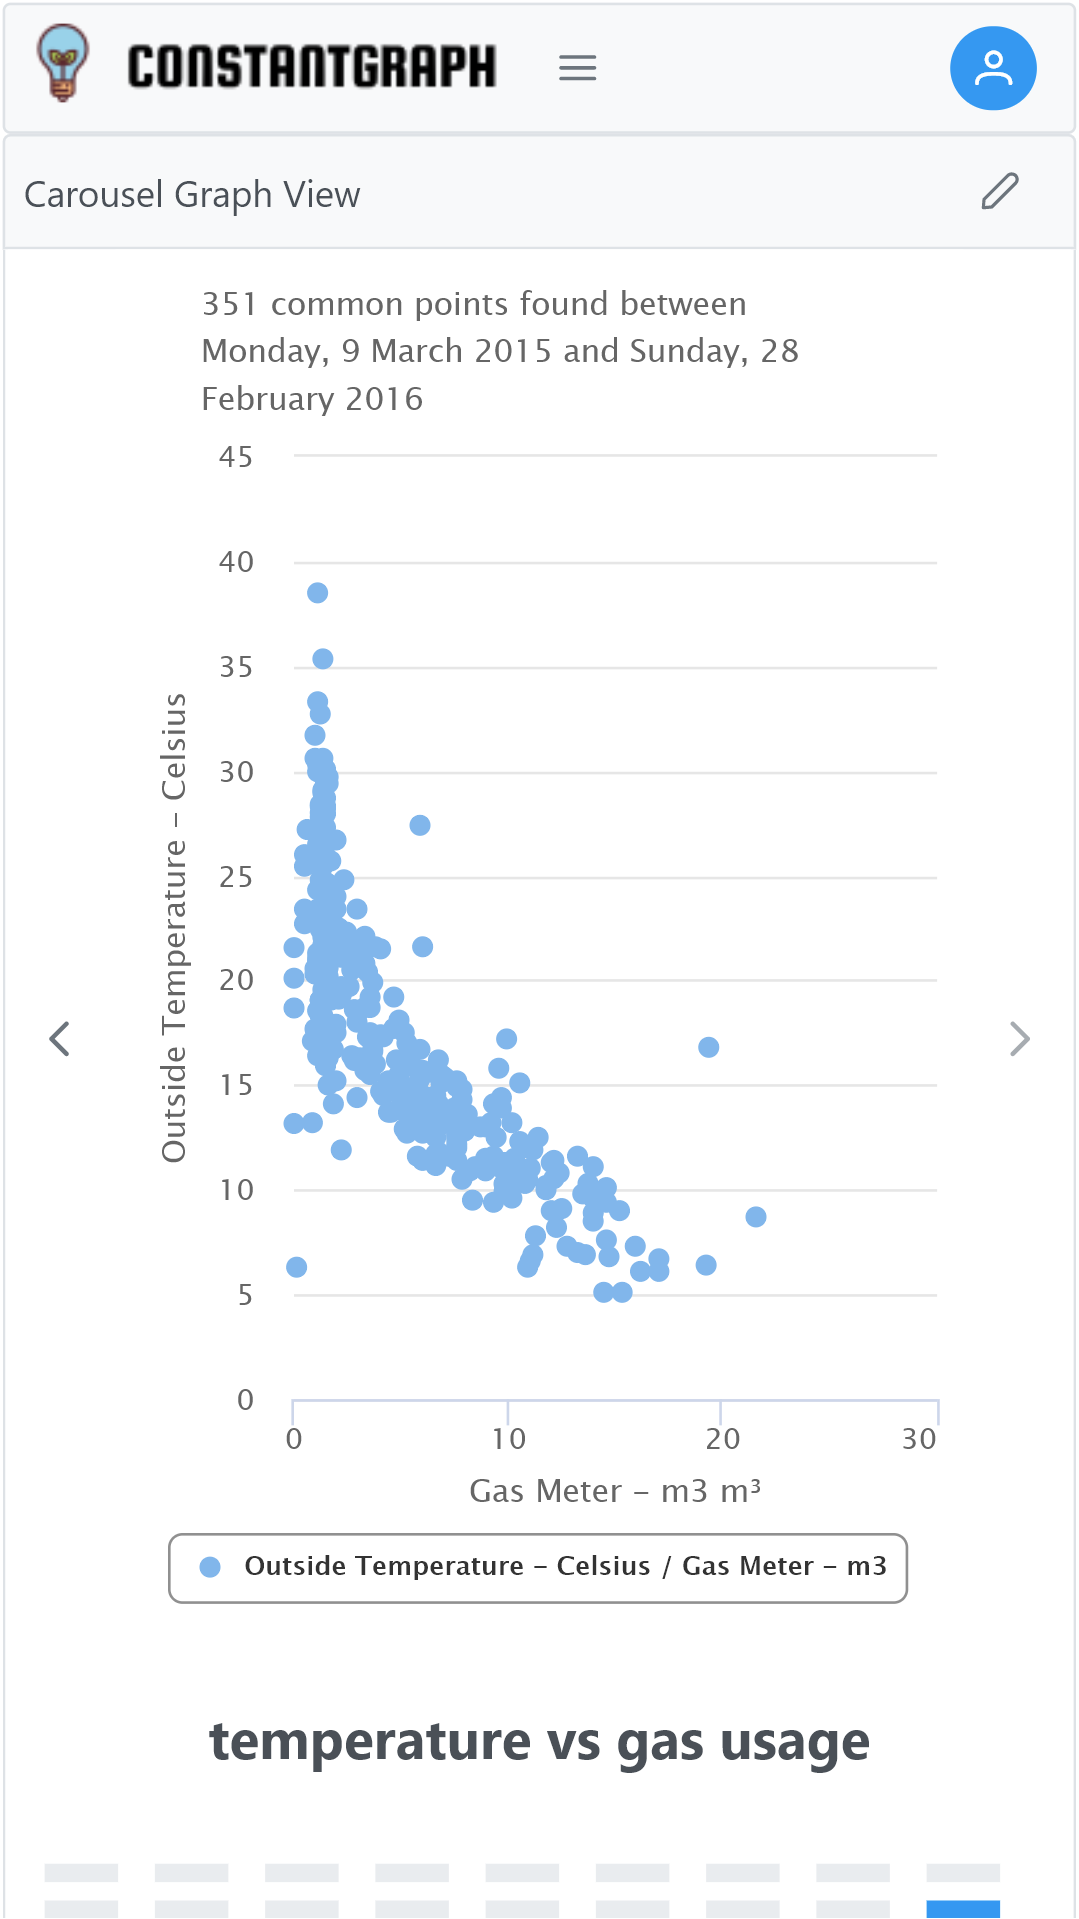
I’ve just released an interesting new feature on ConstantGraph to allow comparison between two channels using a scatter plot. For example you can compare your daily gas usage with the daily maximum temperature to get a plot like below. Here you can see the correlation between lower temperatures and higher gas usage, expect when the temperature goes above about 15 degrees outside when the gas usage is about the same. This can help save energy by understanding how different days use different amounts of energy. I’d be interested to see any comparison plots that you have tried and what you have found out. Take a look here: https://www.constantgraph.com/graphs/compare.
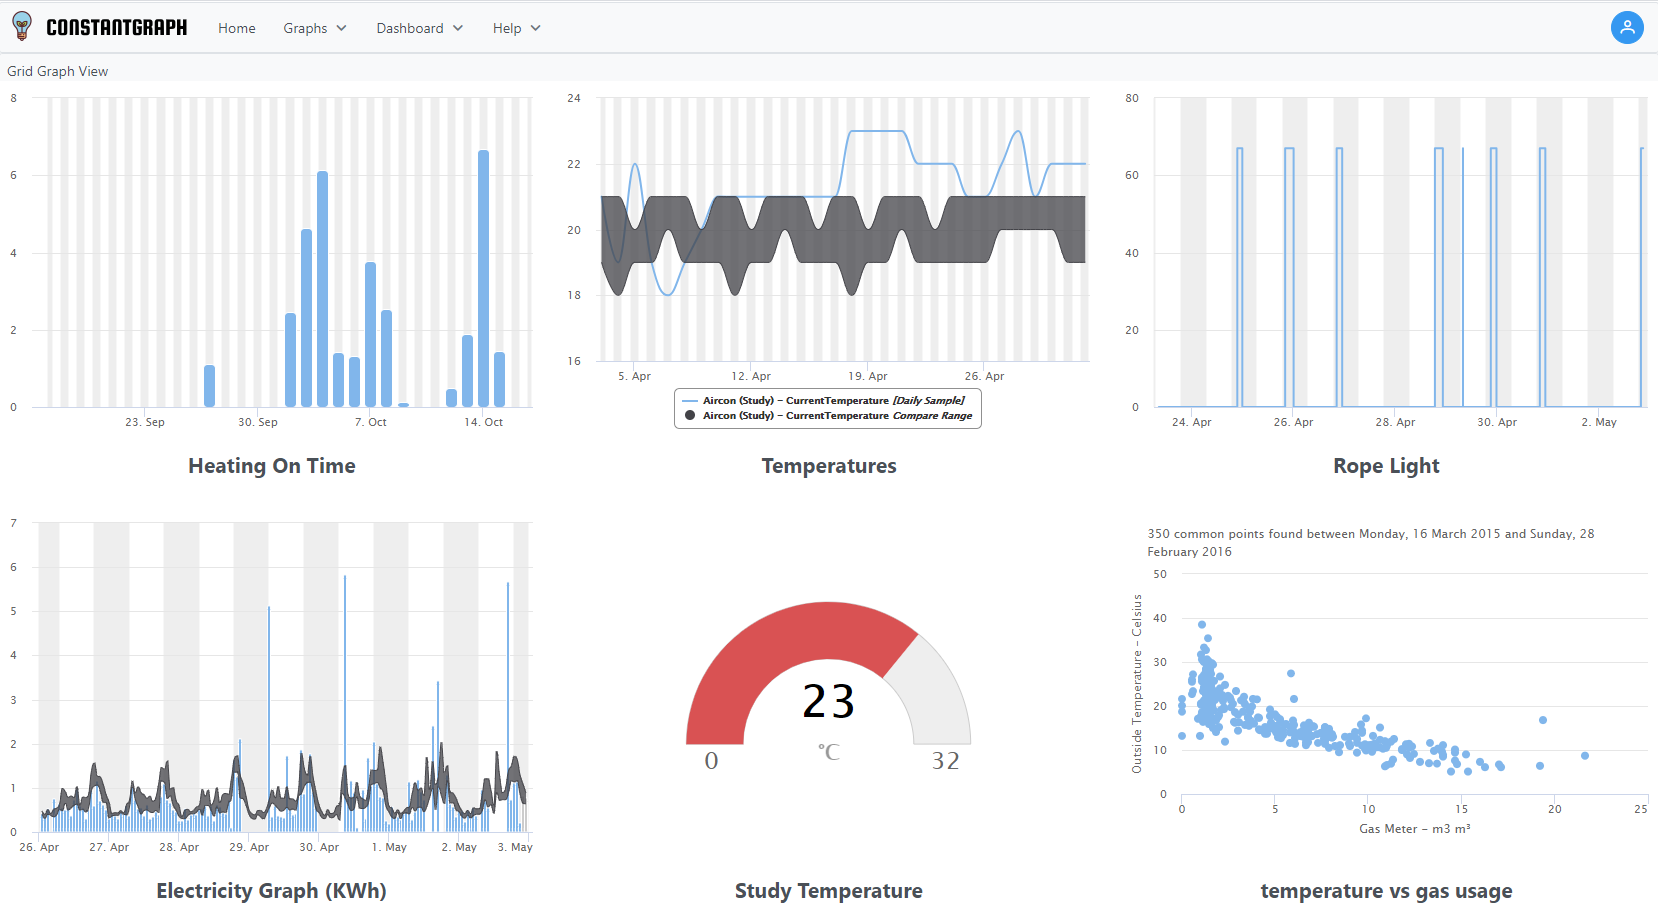
Thank you for all the feedback I’ve had via email. I’ve now added a grid based dashboard page, which allows you to see all of your saved graphs on the page at once. The example below shows an instant temperature gauge as well as a scatter plot of temperature vs gas consumption as well as a graph of electricity usage vs normal usage range. Keep the requests coming in…
https://www.constantgraph.com now has the ability to create custom dashboards 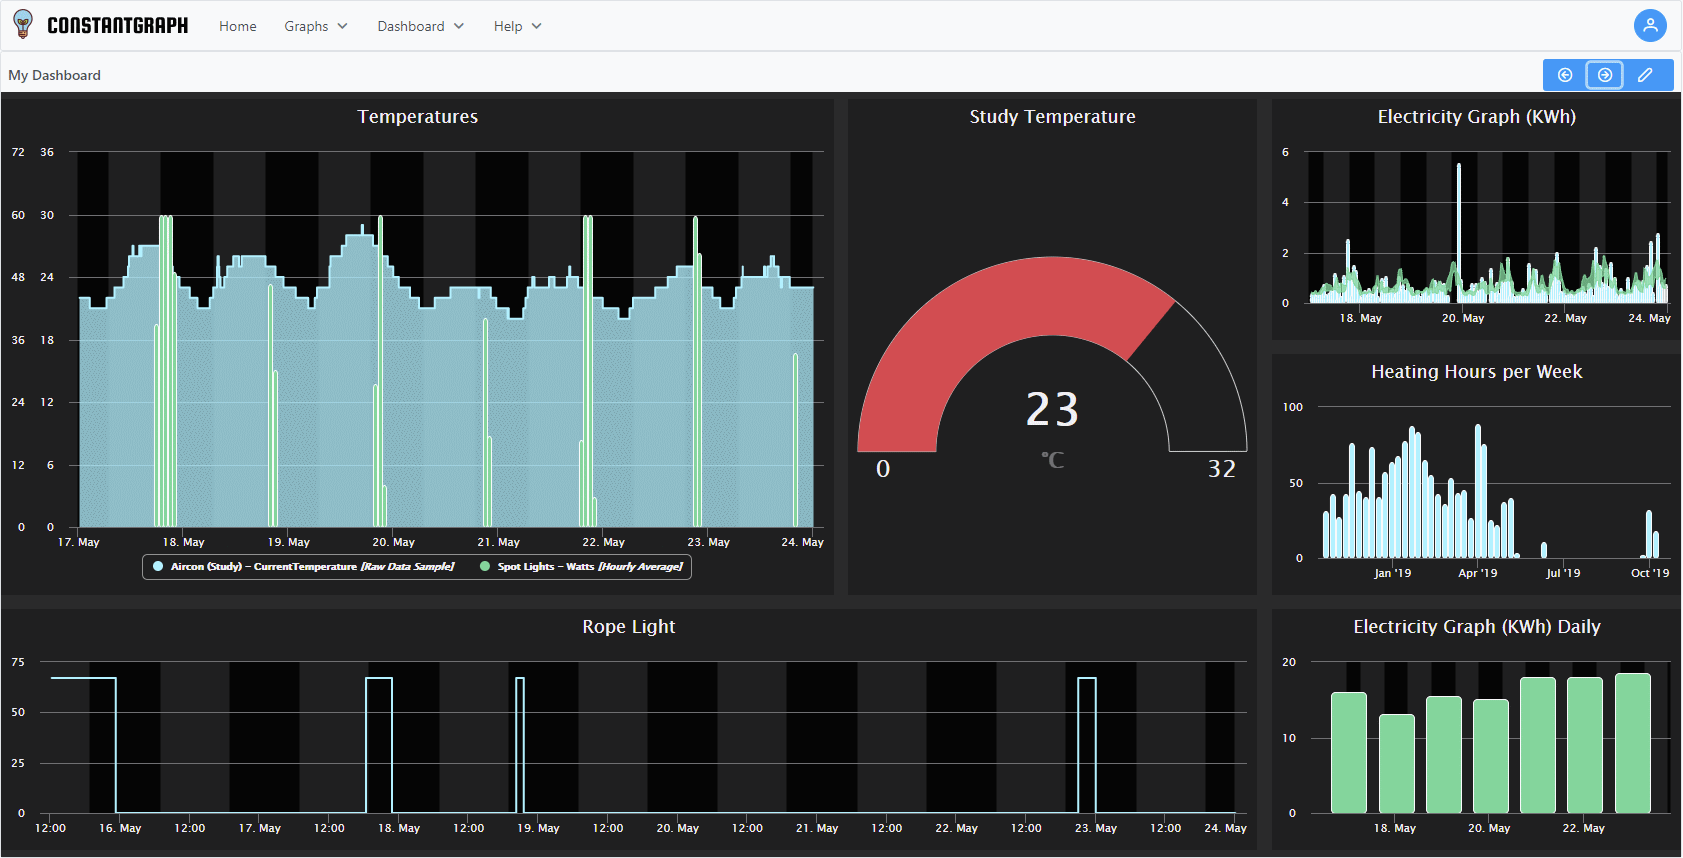 . I’m still working through the list of feedback I’ve had from various users (thanks!) but please let me know what else you’d like to see.
@sknightley, thanks for sharing your project here.
I’m trying to graph the performance of my heating system, for data, I have 6 thermostats in the house (OK, maybe zoning overkill). Also the temperature of a thermal store and outside temperature from a Vera weather plugin.
On the graphs, I was getting some strange effects. With aggregation, it made the data just look like a flat line. With raw data mode it would appear that some of the data samples were missing from some of the data sources. Candidate causes I thought of were: the Vera plugin wasn’t capturing the data correctly, or I had a problem with my vera, or I had some setting problems regarding the graphs, or the aggregation function was too aggressive for temperature variation over 3 hours.
One piece of feedback is that the free pricing tier (which is where we all start, trying out the product) doesn’t let you see the raw data at all - looks like I would get access at a paid-for tier. But, access to a bit of feedback, last few samples for example, would have maybe helped me work out whether the data was getting through to Constantgraph or not. You shouldn’t make it hard for people to debug their initial setup problems.
Hi @alientechnology thanks for getting in touch!
Apologies, I haven’t checked the forum for a couple of days so only just spotted your comments. Having had a quick look at your data (hopefully I guessed the right account) I see that most of your channels have very little data in. E.g. channels 1, 2 and 5 only have a single data point and channels 3, 4 and 6 only have 2 data points. There are a few more points in channel 7 but with so little data, it would be difficult to see very much of a graph.
It looks like either there was an issue with the plug-in or your Vera. If you could go into the plug-in on the Vera UI and click on the ConstantGraph tab and then on the version number (1.100) at the bottom which is a link. This will take you to a debug page which will have some useful diagnostic information in it. Could you please paste the contents of that debug page on this forum or email me at the address at the bottom of the constantgraph.com account page and I’ll take a look to see if I can work out what is going on.
As for seeing the raw data, there are a couple of options. If you go to the Channel Config item under the Graphs menu and select a channel on the left you can see the date range of the data that is in the channel (this would show that your start and end dates of the data are the same). The other way is to select None (Raw Data) under Aggregation Period when plotting a Time Series graph to see the individual data points. However, I take your point that neither of these are exactly what you were asking for. Let me have a think about how I could do that better.
@sknightley I re-installed the plugin and cleared the channels to start again.
At the moment, some channels appear to have a single data point, and others have many. Channel 8 has a temperature sensor which is reporting to nearest 0.01C, so that’s reporting lots of data points. Other temperature sensors are nearest 0.1C so there are fewer data points. One ‘sensor’ is a weather service that reports to the nearest 1C, and presumably changes the weather reading no more often than a few hours. I guess if there’s no change, there’s no data to graph?
I’ve emailed the Vera debug page to your email.
@alientechnology I have added a button on the Graphs > Channel Config page called “Download raw data” that downloads a raw csv file of the data that has been uploaded for the channel, which will hopefully help with your debugging. Note that the raw data gets deleted after a while leaving only the aggregated data.
Thanks for the debug page, I’ll take a look in a bit and respond via email, but your comments are correct, if there is no change in the data then nothing is sent. It appears data is coming through now so it may be all OK.
With the latest release of the app I have now changed it so that even if the data hasn’t changed a value is still sent occasionally. This means that data that changes frequently is sent often (e.g. once every 30 seconds) and data that doesn’t change is sent infrequently (e.g. every 3 hours). The instant data charts now also update automatically as the data changes (although there can be a lag of 1-15 minutes depending on how much data you are sending through).
This means you can create a dashboard with energy usage for a number of devices and leave it open and see the live data values as they change.
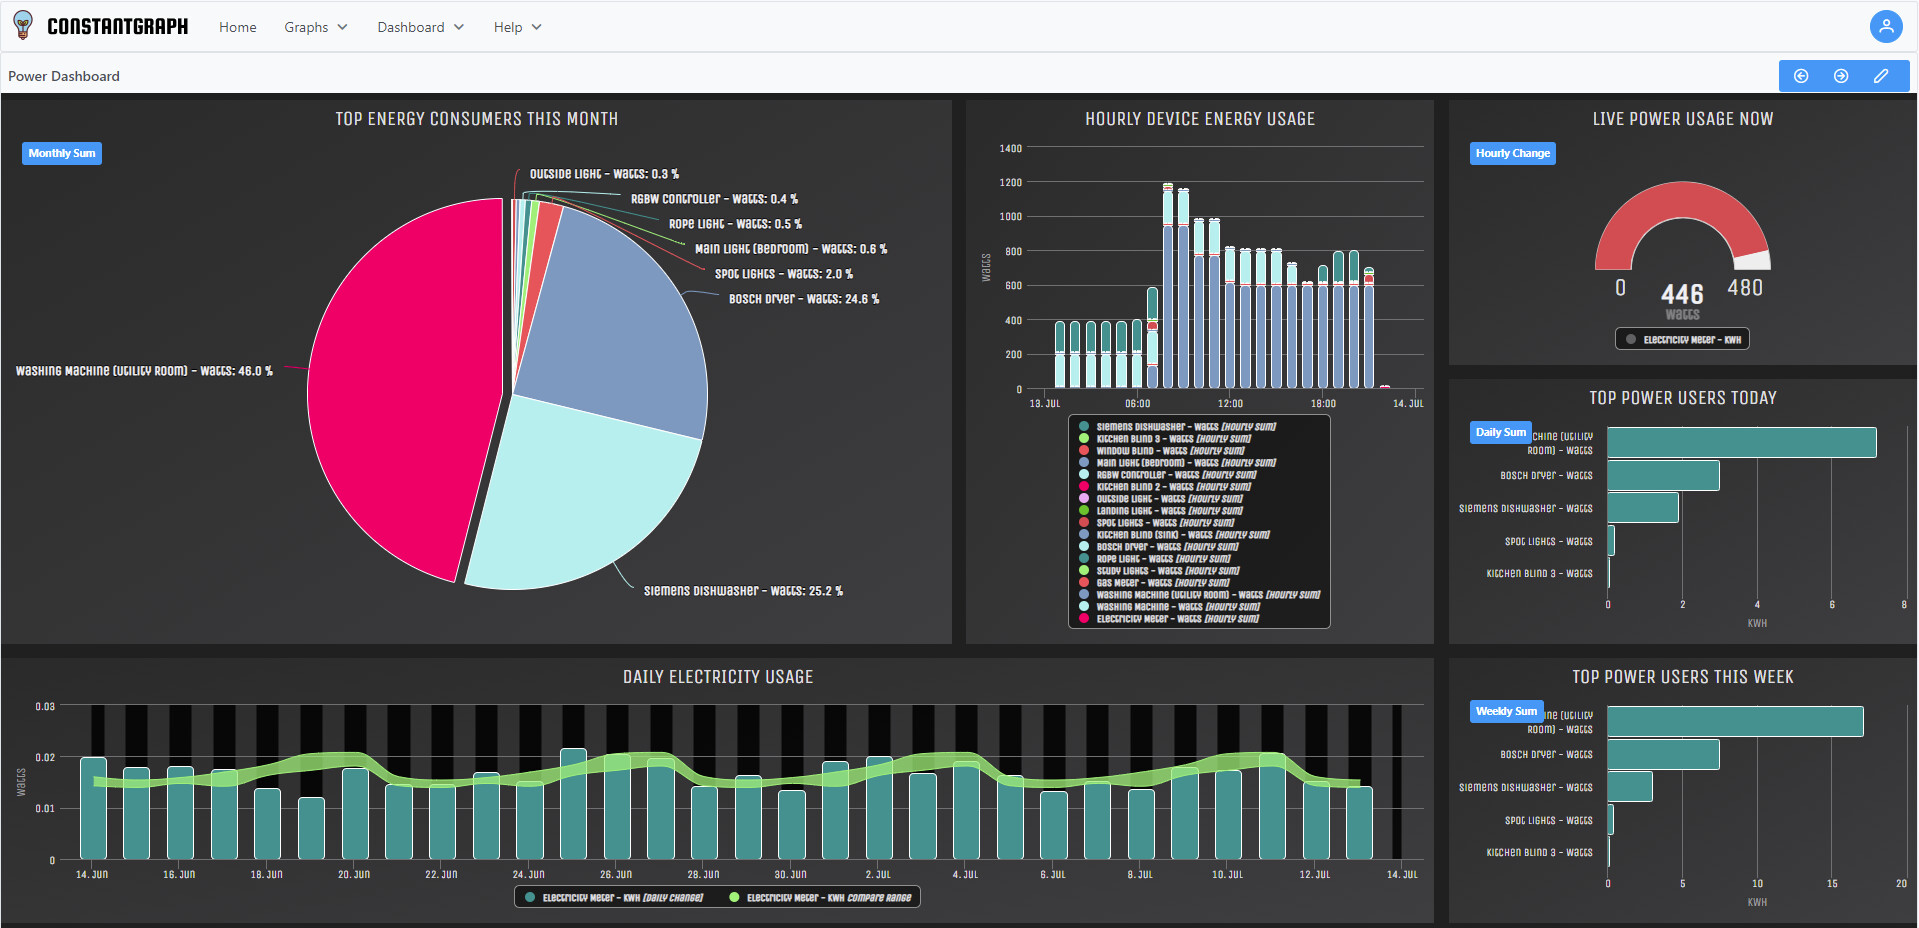
The latest release includes a new pie chart and bar chart that update dynamically as the server data changes. This allows creation of a Power Dashboard like this one…
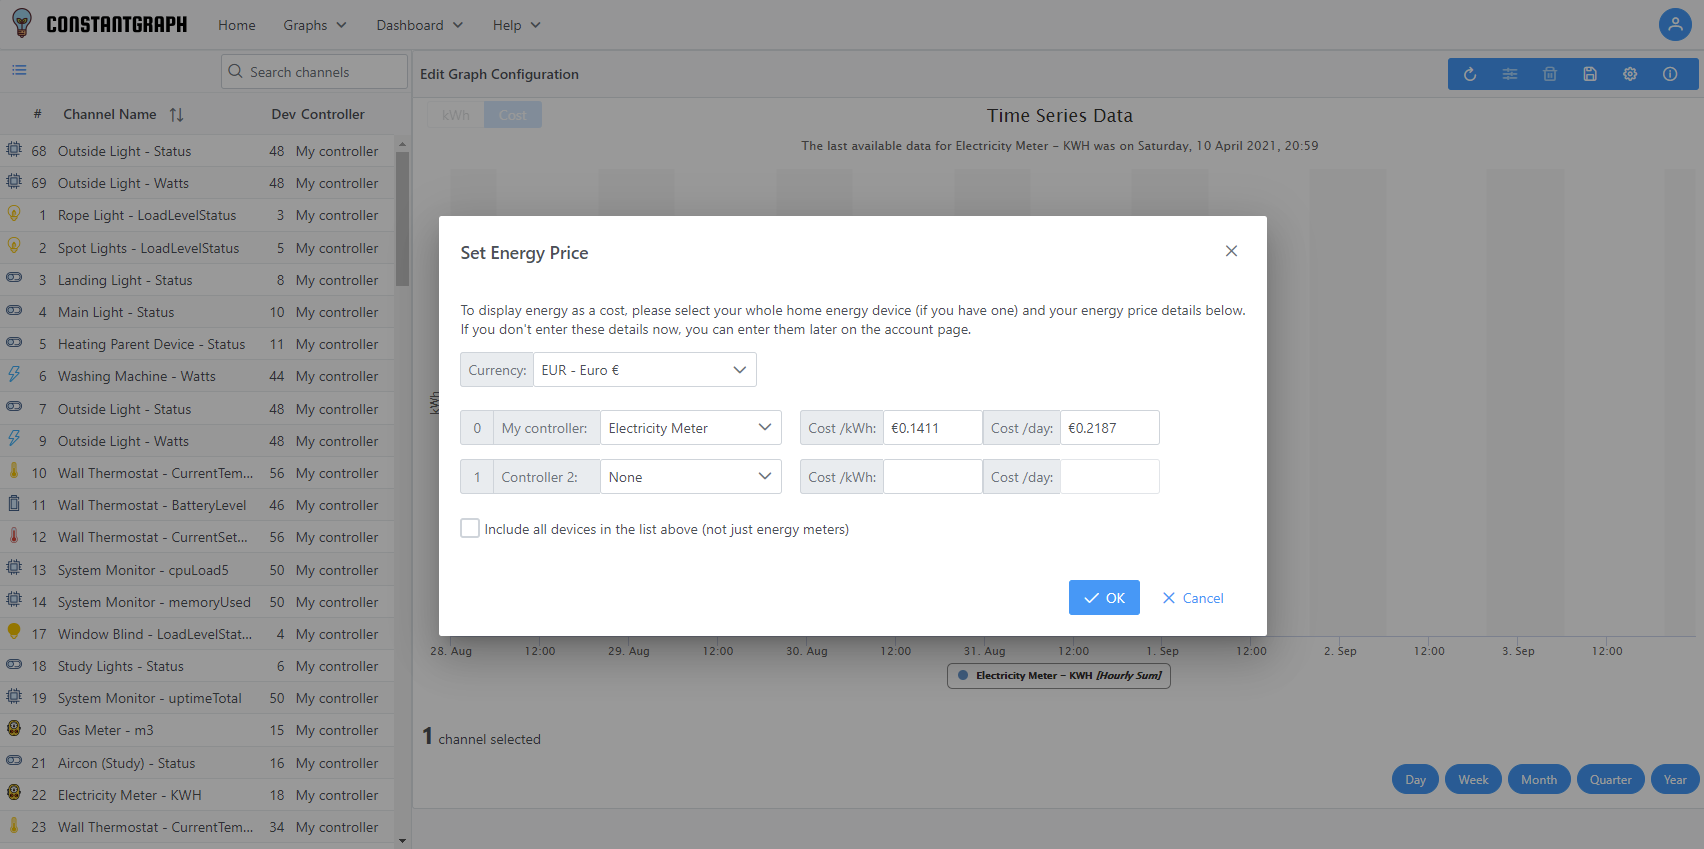
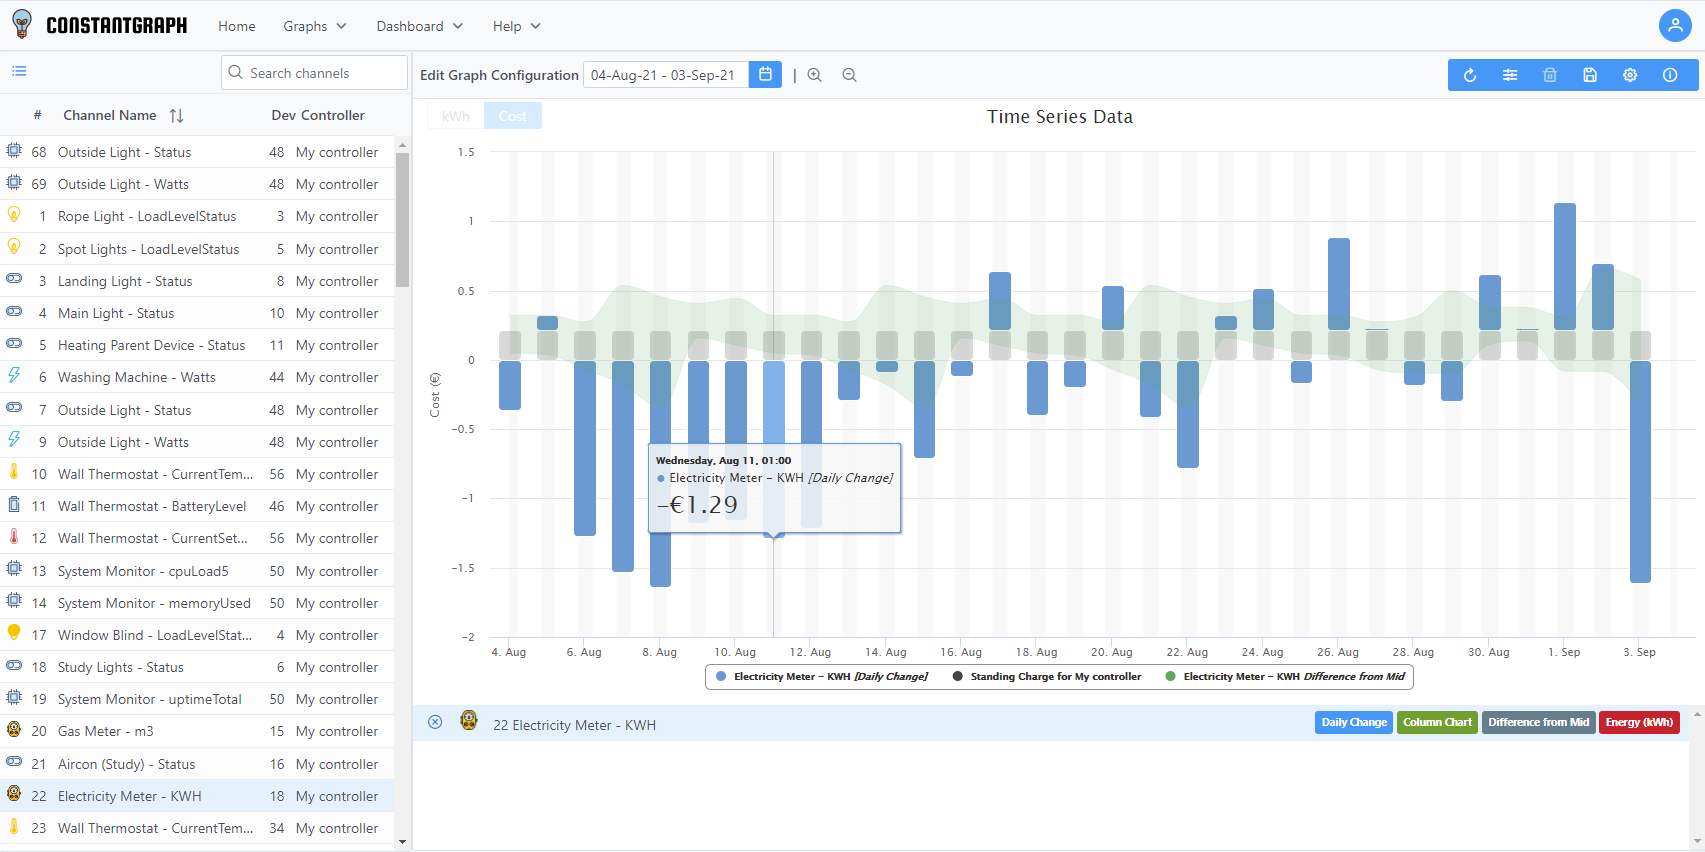
The latest version now adds the ability to add your energy tariff and show your energy usage in local currency. This allows you to easily see how much you are spending on energy for each device.
Combining this with the comparison to normal usage you are able to see what days cost more than normal vs what days cost less.
Also, following some user feedback, there is are now simple and advanced ways to create the time series graphs. The simple view determines the best graph presets for you based on the channel types.