Hi
My datayours (or at least the graphing) stopped updating a couple of days back. Where do I go to start troubleshooting?
Cheers
C
Hi
My datayours (or at least the graphing) stopped updating a couple of days back. Where do I go to start troubleshooting?
Cheers
C
The first stop for diagnostics is the device control page where you should find links to the configuration and status of DataWatcher, DataCache, and DataGraph.
DataWatcher should tell you in the tally table how many new data values it has seen, whereas DataCache will tell you how many it has received and stored.
Beyond that, I’d need to more more about your configuration… is this Vera or openLuup, are you using AltUI, if so, are you using the Data Storage Provder push functionality there, …
Anything of interest in the log?
Hi
It’s vera plus, standard UI
only thing I have on the control page is;
Graph Cache Dash Watch
6 metrics
If you like this plugin, you could DONATE to Cancer Research UK right here
Which seems wrong…
Only thing I can see in the logs is the memory usage?
Any help?
Cheers
C
What version are you running of DataYours?
Current Version:
8.20160129
Latest Version
N/A
I shall update it
No difference…
C
Fixed on reboot
Cheers
C
![]()
I’m now running into the same situation…I see this in the cache page…
DAEMON = {
VERSION = _VERSION,
client = "DataCache",
destinations = {},
errors = {
count = 1,
message = "ERROR: address already in use",
time = "Fri Feb 12 02:13:11 2021"
I would appreciate some help in finding out what the error message means and how to trouble shoot the problem. Was logging fine for over a year, and in the last few days I get this error and logging stops. The only thing that will fix it is a reboot of vera (not a luup reload). But, the error returns in several hours. Where should I look first. What does ‘address’ pertain to?
Thanks.
Tell me something more about your configuration. Something must have changed recently, because DataYours certainly hasn’t.
Lets see…recently installed Virtual HTTP Devices plug-in, but am not using it; I found a different way to control some Wi-Fi LED strips. I implemented control of the Wi-Fi LED strips using curl inside a os.execute lua command inside of PLEG. I also have a new Yamaha receiver, so I have another instance of that plug-in, I did disconnect the old one and it is off the network.
That’s about all I’ve done in the last month or so. I’m not sure that the Data Cache address is referring to; maybe there is a conflict that has arisen? But, not sure what address I should check (IP, port, MAC, where the data is going, where the data is generated, etc.)
Any thoughts? As you know I’m also trying to resolve this problem by moving to Historian on OpenLuup. But, don’t like unsolved problems.
I’d like to see:
It’s probably the port which the error message is referring to. It needs to set up a watch for incoming UDP datagrams with the new incoming values. It shouldn’t be a conflict (unless you somehow have two copies running.) Is this on Vera or openLuup?
For reference, the part of my log showing DataYours startup is herE:
2021-02-13 17:08:01.426   luup_log:130: DataYours: starting...
2021-02-13 17:08:01.426   luup.variable_set:: 130.urn:akbooer-com:serviceId:DataYours1.StartTime was: Tue Feb  9 18:18:02 2021 now: Sat Feb 13 17:08:01 2021 #hooks:0
2021-02-13 17:08:01.427   luup.variable_set:: 130.urn:upnp-org:serviceId:altui1.DisplayLine1 was: Graph Cache Watch now: no services #hooks:0
2021-02-13 17:08:01.427   luup.variable_set:: 130.urn:upnp-org:serviceId:altui1.DisplayLine2 was: 412 metrics now: no database #hooks:0
2021-02-13 17:08:01.427   luup_log:130: DataYours: starting heartbeat
2021-02-13 17:08:01.436   luup.variable_set:: 130.urn:upnp-org:serviceId:altui1.DisplayLine2 was: no database now: 412 metrics #hooks:0
2021-02-13 17:08:01.437   luup.variable_set:: 130.urn:akbooer-com:serviceId:DataYours1.AppMemoryUsed was: 12819 now: 5193 #hooks:0
2021-02-13 17:08:01.476   luup_log:130: DataYours: starting services
2021-02-13 17:08:01.476   luup_log:130: DataYours:  service: Graph - L_DataGraph
2021-02-13 17:08:01.501   luup.register_handler:: global_function_name=HTTP_DataGraph, request=DataGraph
2021-02-13 17:08:01.502   luup.register_handler:: global_function_name=HTTP_DataGraphRenderer, request=render
2021-02-13 17:08:01.502   luup.register_handler:: global_function_name=HTTP_DataGraphRenderer, request=grafana/render
2021-02-13 17:08:01.502   luup_log:130: DataYours:  service: Cache - L_DataCache
2021-02-13 17:08:01.504   luup.register_handler:: global_function_name=HTTP_DataCache, request=DataCache
2021-02-13 17:08:01.505   luup_log:130: DataYours:  service: Watch - L_DataWatcher
2021-02-13 17:08:01.509   luup_log:130: DataDaemon: unable to open /www/DataWatcher.conf
2021-02-13 17:08:01.509   luup_log:130: DataDaemon: unable to open /www/DataTranslation.conf
2021-02-13 17:08:01.509   luup.register_handler:: global_function_name=HTTP_DataWatcher, request=DataWatcher
2021-02-13 17:08:01.510   luup_log:130: DataWatcher: starting variable watch...
2021-02-13 17:08:01.510   luup.register_handler:: global_function_name=HTTP_DataWatcherRelay, request=DataWatcherRelay
2021-02-13 17:08:01.510   luup_log:130: DataWatcher: registering with AltUI [3] as Data Storage Provider
2021-02-13 17:08:01.511   luup.call_action:: 3.urn:upnp-org:serviceId:altui1.RegisterDataProvider
2021-02-13 17:08:01.511   luup_log:130: DataYours: ...startup complete
I’d also like to see the log when the error occurs, but you say that this happens after a few hours?
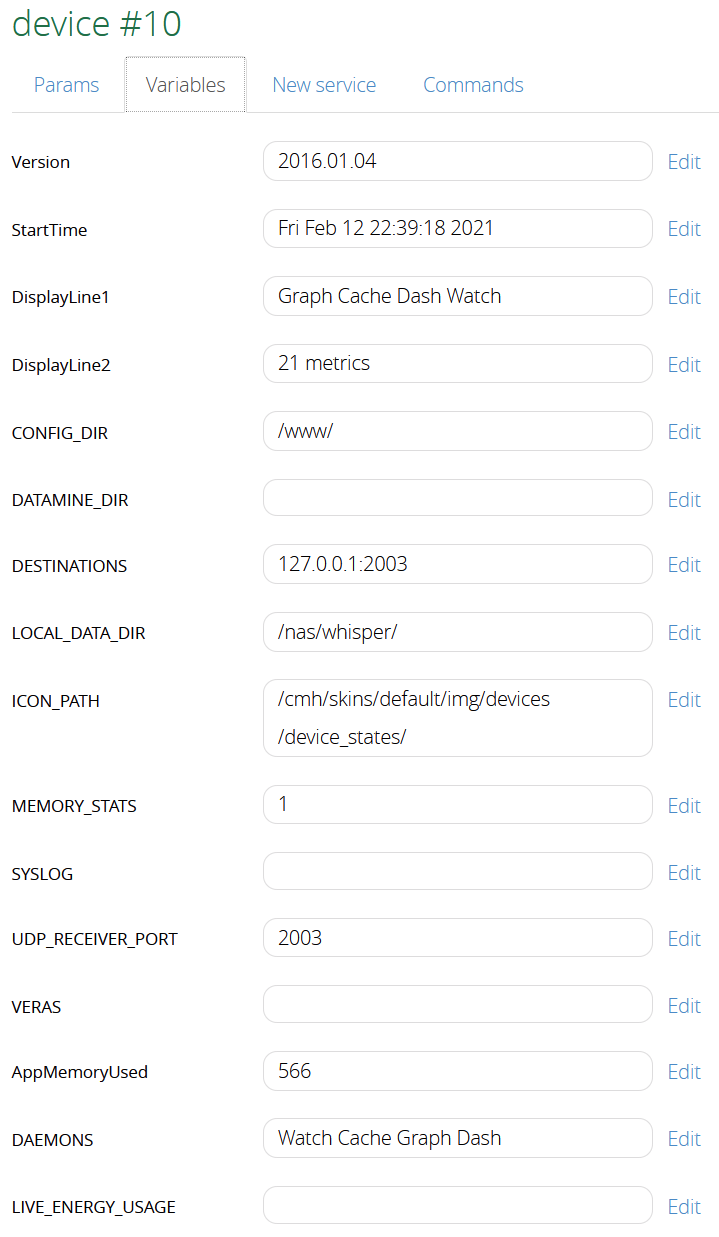
DataYours variable page:
DataYours startup…
50	02/13/21 11:34:17.289	luup_log:10: DataYours: starting... <0x76ef6520>
06	02/13/21 11:34:17.290	Device_Variable::m_szValue_set device: 10 service: urn:akbooer-com:serviceId:DataYours1 variable: StartTime was: Fri Feb 12 22:39:18 2021 now: Sat Feb 13 11:34:17 2021 #hooks: 0 upnp: 0 skip: 0 v:(nil)/NONE duplicate:0 <0x76ef6520>
06	02/13/21 11:34:17.290	Device_Variable::m_szValue_set device: 10 service: urn:upnp-org:serviceId:altui1 variable: DisplayLine1 was: Graph Cache Dash Watch now: no services #hooks: 0 upnp: 0 skip: 0 v:(nil)/NONE duplicate:0 <0x76ef6520>
06	02/13/21 11:34:17.291	Device_Variable::m_szValue_set device: 10 service: urn:upnp-org:serviceId:altui1 variable: DisplayLine2 was: 21 metrics now: no database #hooks: 0 upnp: 0 skip: 0 v:(nil)/NONE duplicate:0 <0x76ef6520>
50	02/13/21 11:34:17.291	luup_log:10: DataYours: starting heartbeat <0x76ef6520>
06	02/13/21 11:34:17.293	Device_Variable::m_szValue_set device: 10 service: urn:upnp-org:serviceId:altui1 variable: DisplayLine2 was: no database now: [string "-------------------------------------------..."]:94: cannot open /nas/whisper/: No such file or directory #hooks: 0 upnp: 0 skip: 0 v:(nil)/NONE duplicate:0 <0x76ef6520>
06	02/13/21 11:34:17.294	Device_Variable::m_szValue_set device: 10 service: urn:akbooer-com:serviceId:DataYours1 variable: AppMemoryUsed was: 566 now: 215 #hooks: 0 upnp: 0 skip: 0 v:(nil)/NONE duplicate:0 <0x76ef6520>
50	02/13/21 11:34:17.297	luup_log:10: DataYours: starting services <0x76ef6520>
50	02/13/21 11:34:17.297	luup_log:10: DataYours:  service: Graph - L_DataGraph <0x76ef6520>
50	02/13/21 11:34:17.352	luup_log:10: DataYours:  service: Cache - L_DataCache <0x76ef6520>
50	02/13/21 11:34:17.363	luup_log:10: DataYours:  service: Dash - L_DataDash <0x76ef6520>
50	02/13/21 11:34:17.402	luup_log:10: ERROR: unable to open /www/DataDash.conf <0x76ef6520>
50	02/13/21 11:34:17.423	luup_log:10: DataDash: DataDash7 daemon started <0x76ef6520>
50	02/13/21 11:34:17.423	luup_log:10: DataYours:  service: Watch - L_DataWatcher <0x76ef6520>
50	02/13/21 11:34:17.440	luup_log:10: ERROR: unable to open /www/DataTranslation.conf <0x76ef6520>
50	02/13/21 11:34:17.441	luup_log:10: DataWatcher: starting variable watch... <0x76ef6520>
50	02/13/21 11:34:17.444	luup_log:10: DataWatcher: starting memory watch... <0x76ef6520>
50	02/13/21 11:34:17.446	luup_log:10: DataWatcher: registering with AltUI [13] as Data Storage Provider <0x76ef6520>
08	02/13/21 11:34:17.448	JobHandler_LuaUPnP::HandleActionRequest device: 13 service: urn:upnp-org:serviceId:altui1 action: RegisterDataProvider <0x76ef6520>
08	02/13/21 11:34:17.448	JobHandler_LuaUPnP::HandleActionRequest argument newUrl=http://127.0.0.1:3480/data_request?id=lr_DataWatcherRelay&target={0} <0x76ef6520>
08	02/13/21 11:34:17.448	JobHandler_LuaUPnP::HandleActionRequest argument newName=datayours <0x76ef6520>
08	02/13/21 11:34:17.449	JobHandler_LuaUPnP::HandleActionRequest argument newJsonParameters=[{
 "default":"unknown",
 "key":"target",
 "label":"Metric Name",
 "type":"text"
},{
  "default":"http:\/\/192.168.XXX.XXX:3480\/data_request?id=lr_render&target={0}&hideLegend=true&height=250&from=-y",
 "key":"graphicurl",
 "label":"Graphic Url",
"type":"url"
}] <0x76ef6520>
02	02/13/21 11:34:17.449	Device_LuaUPnP::HandleActionRequest 13 not ready 0xc1fd18 <0x76ef6520>
50	02/13/21 11:34:17.449	luup_log:10: DataYours: ...startup complete <0x76ef6520>
06	02/13/21 11:34:17.450	Device_Variable::m_szValue_set device: 10 service: urn:upnp-org:serviceId:altui1 variable: DisplayLine1 was: no services now: Graph Cache Dash Watch #hooks: 0 upnp: 0 skip: 0 v:(nil)/NONE duplicate:0 <0x76ef6520>
50	02/13/21 11:34:17.571	luup_log:0: cifsmount: '//192.168.XXX.XXX/SkogenDataYours' mounted status: nil <0x76ef6520>
50	02/13/21 11:34:17.572	luup_log:0: cifsmount: '//192.168.XXX.XXX/SkogenDataYours' mounted OK: 0 <0x76ef6520>
Hmm…Looks like DataYours started up before my CIFS mount. That doesn’t happen every time, sometimes it starts up in the desired order (CIFS mount then DataYours). BTW, I’m using code you shared for the CIFS mount in the Lua startup code.
But this doesn’t explain why I’m losing logging after several hours…I’ve checked the mount after data logging stops and the mount is ok. I’ll reboot vera again and see if the CIFS drive will mount before DataYours starts…
Happened in the same order after another Vera reboot
After several attempts, DataYours starts up before my CIFS mount, the DataCache error message is present and no logging. Is there any way to force DataYours to delay startup or to reinitialize it after the CIFS mount is complete?
That doesn’t seem to be it (DataYours starting before CIFS mount). Now, in the logs I see the CIFS mount has occured prior to DataYours starting. DataYours still showing the error…
50	02/13/21 21:56:36.135	luup_log:10: DataYours: starting services <0x76ea4520>
50	02/13/21 21:56:36.136	luup_log:10: DataYours:  service: Graph - L_DataGraph <0x76ea4520>
50	02/13/21 21:56:36.174	luup_log:10: DataYours:  service: Cache - L_DataCache <0x76ea4520>
50	02/13/21 21:56:36.184	luup_log:10: DataCache: ERROR: address already in use <0x76ea4520>
50	02/13/21 21:56:36.184	luup_log:10: DataYours:  service: Dash - L_DataDash <0x76ea4520>
50	02/13/21 21:56:36.214	luup_log:10: ERROR: unable to open /www/DataDash.conf <0x76ea4520>
50	02/13/21 21:56:36.255	luup_log:10: DataDash: DataDash7 daemon started <0x76ea4520>
50	02/13/21 21:56:36.256	luup_log:10: DataYours:  service: Watch - L_DataWatcher <0x76ea4520>
50	02/13/21 21:56:36.269	luup_log:10: ERROR: unable to open /www/DataTranslation.conf <0x76ea4520>
The files …DataDash.conf and DataTranslation.conf are presumably needed, correct. Perhaps my last Vera update wiped them out? Still,
50 02/13/21 21:56:36.184 luup_log:10: DataCache: ERROR: address already in use <0x76ea4520>
Can’t figure it out.
I can only think that something else is accessing the port on the machine.
You can check which ports are in use with a shell command. On one of my systems this gives:
# netstat -tulpn
Active Internet connections (only servers)
Proto Recv-Q Send-Q Local Address           Foreign Address         State       PID/Program name
tcp        0      0 0.0.0.0:11011           0.0.0.0:*               LISTEN      12068/lua5.1
tcp        0      0 0.0.0.0:22              0.0.0.0:*               LISTEN      845/sshd
tcp        0      0 127.0.0.1:3350          0.0.0.0:*               LISTEN      834/xrdp-sesman
tcp        0      0 0.0.0.0:3480            0.0.0.0:*               LISTEN      12068/lua5.1
tcp        0      0 0.0.0.0:2525            0.0.0.0:*               LISTEN      12068/lua5.1
tcp        0      0 0.0.0.0:3389            0.0.0.0:*               LISTEN      808/xrdp
tcp6       0      0 :::8080                 :::*                    LISTEN      868/apache2
tcp6       0      0 :::22                   :::*                    LISTEN      845/sshd
tcp6       0      0 :::3000                 :::*                    LISTEN      592/grafana-server
udp        0      0 0.0.0.0:5353            0.0.0.0:*                           573/avahi-daemon: r
udp        0      0 0.0.0.0:48142           0.0.0.0:*                           1212/dhclient
udp        0      0 0.0.0.0:67              0.0.0.0:*                           1022/udhcpd
udp        0      0 0.0.0.0:68              0.0.0.0:*                           1212/dhclient
udp        0      0 0.0.0.0:59331           0.0.0.0:*                           573/avahi-daemon: r
udp6       0      0 :::5353                 :::*                                573/avahi-daemon: r
udp6       0      0 :::14371                :::*                                1212/dhclient
udp6       0      0 :::49101                :::*                                573/avahi-daemon: r
I’m also very perplexed by your mount problems. The startup code should call the mount command synchronously and not return until it’s done. I’ve never seen a problem with doing this.
Additionally, the mount only occurs on the first Luup restart after a system reboot. Subsequent Luup restarts should not need to mount anything, since it’s already there. The code I wrote originally checks for this. Thus the target volume should always be mounted before DatsYours starts up. If, for some bizarre reason, it’s not, then a Luup restart, after the volume IS mounted successfully, should also fix the problem.
Well, definitely see that :2003 is being used…
Active Internet connections (only servers)
Proto Recv-Q Send-Q Local Address           Foreign Address         State       PID/Program name
tcp      129      0 0.0.0.0:49451           0.0.0.0:*               LISTEN      7700/lua
tcp        0      0 0.0.0.0:49453           0.0.0.0:*               LISTEN      25796/LuaUPnP
tcp        0      0 0.0.0.0:80              0.0.0.0:*               LISTEN      5830/lighttpd
tcp        0      0 0.0.0.0:53              0.0.0.0:*               LISTEN      3968/sh
tcp        0      0 0.0.0.0:22              0.0.0.0:*               LISTEN      6431/dropbear
tcp        0      0 0.0.0.0:3480            0.0.0.0:*               LISTEN      25796/LuaUPnP
tcp        0      0 :::53                   :::*                    LISTEN      3968/sh
tcp        0      0 :::22                   :::*                    LISTEN      6431/dropbear
udp        0      0 0.0.0.0:53              0.0.0.0:*                           3968/sh
udp        0      0 0.0.0.0:67              0.0.0.0:*                           3968/sh
udp        0      0 0.0.0.0:1900            0.0.0.0:*                           25796/LuaUPnP
udp   165760      0 0.0.0.0:1900            0.0.0.0:*                           7700/lua
udp        0      0 127.0.0.1:34717         0.0.0.0:*                           25796/LuaUPnP
udp        0      0 127.0.0.1:56513         0.0.0.0:*                           7700/lua
udp   164032      0 0.0.0.0:2003            0.0.0.0:*                           7700/lua
udp        0      0 :::546                  :::*                                3878/odhcp6c
udp        0      0 :::547                  :::*                                1836/odhcpd
udp        0      0 :::53                   :::*                                3968/sh
Any idea how to figure out what ‘7700/lua’ pertains to?
Okay, I tracked down PID 7700…
7700 1 root S 6480 2.5 1 0.0 lua /tmp/ezviz/ezviz_video_manage
What is this??? Could this have been part of the latest Vera update, some camera thing that I don’t use.
That may be it! Kill the process and see.
Best Home Automation shopping experience. Shop at Ezlo!
© 2026 Ezlo Innovation, All Rights Reserved. Terms of Use | Privacy Policy | Forum Rules