It doesn’t seem to be sending the Percent value, if you look at the debug there is no value at the end of the HTTP Json command

what is the payload code? in the function.
msg.headers = {};
msg.payload = {"id":  "variableset",
 "DeviceNum": "100",
"serviceId": "urn:micasaverde-com:serviceId:GenericSensor1",
"Variable": "CurrentLevel",
"Value": msg.payload.percent}
return msg;
Strange,put the debug after the function, to see what the payload is before the request.
18/09/2020, 19:30:28node: Debug
msg : Object
object
_msgid: "bedad31c.87d68"
payload: object
id: "variableset"
DeviceNum: "100"
serviceId: "urn:micasaverde-com:serviceId:GenericSensor1"
Variable: "CurrentLevel"
topic: ""
statusCode: 200
headers: object
empty
responseUrl: "http://192.168.0.2:61208/api/3/mem/percent"
redirectList: array[0]
This is all three debug nodes:
18/09/2020, 19:34:23node: Debug
msg : Object
object
_msgid: "5e5bb723.3ca968"
payload: "{"percent": 47.8}"
topic: ""
statusCode: 200
headers: object
date: "Fri, 18 Sep 2020 18:34:24 GMT"
server: "WSGIServer/0.2 CPython/3.8.5"
access-control-allow-origin: "*"
access-control-allow-methods: "GET, POST, PUT, OPTIONS"
access-control-allow-headers: "Origin, Accept, Content-Type, X-Requested-With, X-CSRF-Token"
content-type: "application/json; charset=utf-8"
content-encoding: "identity"
content-length: "17"
x-node-red-request-node: "7a6a22c0"
responseUrl: "http://192.168.0.2:61208/api/3/mem/percent"
redirectList: array[0]
18/09/2020, 19:34:23node: Debug
msg : Object
object
_msgid: "5e5bb723.3ca968"
payload: object
id: "variableset"
DeviceNum: "100"
serviceId: "urn:micasaverde-com:serviceId:GenericSensor1"
Variable: "CurrentLevel"
topic: ""
statusCode: 200
headers: object
empty
responseUrl: "http://192.168.0.2:61208/api/3/mem/percent"
redirectList: array[0]
18/09/2020, 19:34:23node: Debug
msg : Object
object
_msgid: "5e5bb723.3ca968"
payload: "OK"
topic: ""
statusCode: 200
headers: object
responseUrl: "http://192.168.0.248:3480/data_request?id=variableset&DeviceNum=100&serviceId=urn%3Amicasaverde-com%3AserviceId%3AGenericSensor1&Variable=CurrentLevel&Value="
redirectList: array[0]
The response URL looks a bit funky.
Maybe the first HTTP request node is wrong its set to Ignore
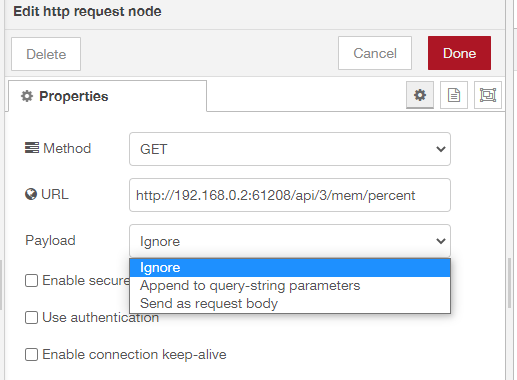
EDIT:
Doesn’t seem to make any difference changing the payload type.
Msg.payload has been returned from the api as a JSON string.
msg.headers = {};
var message = JSON.prase(msg.payload);
msg.payload = {"id":  "variableset",
 "DeviceNum": "100",
"serviceId": "urn:micasaverde-com:serviceId:GenericSensor1",
"Variable": "CurrentLevel",
"Value": message.percent}
return msg;
That works !

Great thanks ![]()
So I just need some mechanism to poll the server “Glances” API.
I could setup a schedule in PLEG to send a HTTP command to a Node-Red HTTP IN node, to initiate the flow.
Or maybe you can setup a schedule actually in node red ?

Sweet nice one !
Will see if I can add this virtual device in to the Imperihome app now.
Just wondering if your first http request node is set up to return the api request as a string or a object. you could probably lose the JSON.prase() if the node is set to return a Prase JSON object.
e.g.

Its currently set to a UFT 8 String
If you wish to fiddle more you could change that and revert to original function.
1 Like
I’ve changed it to Parse JSON and changed the function back to this
msg.headers = {};
msg.payload = {"id":  "variableset",
 "DeviceNum": "100",
"serviceId": "urn:micasaverde-com:serviceId:GenericSensor1",
"Variable": "CurrentLevel",
"Value": msg.payload.percent}
return msg;
Seems to still work OK.
1 Like
OK here is the working Flow code:

[{"id":"ffa42ff2.1cbe8","type":"tab","label":"Glances","disabled":false,"info":""},{"id":"9f303bf4.81a5f8","type":"http request","z":"ffa42ff2.1cbe8","name":"HTTP Request to Glances - Mem %","method":"GET","ret":"obj","paytoqs":"ignore","url":"http://192.168.0.2:61208/api/3/mem/percent","tls":"","persist":false,"proxy":"","authType":"","x":450,"y":60,"wires":[["5da80ee8.ca5c7","95aeb177.720b3"]]},{"id":"5da80ee8.ca5c7","type":"debug","z":"ffa42ff2.1cbe8","name":"Debug","active":true,"tosidebar":true,"console":false,"tostatus":false,"complete":"true","targetType":"full","statusVal":"","statusType":"auto","x":730,"y":60,"wires":[]},{"id":"4700babf.3febe4","type":"inject","z":"ffa42ff2.1cbe8","name":"Injection Polling Shedule","props":[{"p":"payload"},{"p":"topic","vt":"str"}],"repeat":"300","crontab":"","once":true,"onceDelay":0.1,"topic":"","payload":"","payloadType":"date","x":150,"y":60,"wires":[["9f303bf4.81a5f8"]]},{"id":"4d1a644a.4d78ec","type":"mios-out","z":"ffa42ff2.1cbe8","name":"Vera Virtual Device","server":"49dcbd80.e421e4","item":"WHS Mem Used %:CurrentLevel","x":350,"y":700,"wires":[]},{"id":"95aeb177.720b3","type":"function","z":"ffa42ff2.1cbe8","name":"Payload Code","func":"msg.headers = {};\nmsg.payload = {\"id\": \"variableset\",\n \"DeviceNum\": \"100\",\n\"serviceId\": \"urn:micasaverde-com:serviceId:GenericSensor1\",\n\"Variable\": \"CurrentLevel\",\n\"Value\": msg.payload.percent}\nreturn msg;","outputs":1,"noerr":0,"initialize":"","finalize":"","x":200,"y":120,"wires":[["2a23148.d3228ec","ee04533f.3485"]]},{"id":"591b77d0.608d08","type":"debug","z":"ffa42ff2.1cbe8","name":"Debug","active":true,"tosidebar":true,"console":false,"tostatus":false,"complete":"true","targetType":"full","statusVal":"","statusType":"auto","x":730,"y":120,"wires":[]},{"id":"2a23148.d3228ec","type":"http request","z":"ffa42ff2.1cbe8","name":"HTTP Request to Vera Virtual Device","method":"GET","ret":"txt","paytoqs":"query","url":"http://192.168.0.248:3480/data_request","tls":"","persist":false,"proxy":"","authType":"","x":490,"y":120,"wires":[["591b77d0.608d08"]]},{"id":"ee04533f.3485","type":"debug","z":"ffa42ff2.1cbe8","name":"Debug","active":true,"tosidebar":true,"console":false,"tostatus":false,"complete":"true","targetType":"full","statusVal":"","statusType":"auto","x":390,"y":160,"wires":[]},{"id":"49dcbd80.e421e4","type":"mios-server","z":"","name":"Vera-Edge","host":"192.168.0.248","port":"3480"}]
EDIT:
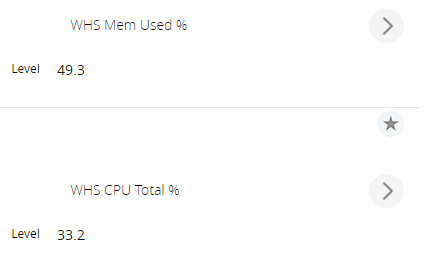
Example with two virtual devices in Vera:
[{"id":"ffa42ff2.1cbe8","type":"tab","label":"Glances","disabled":false,"info":""},{"id":"9f303bf4.81a5f8","type":"http request","z":"ffa42ff2.1cbe8","name":"HTTP Request to Glances - Mem %","method":"GET","ret":"obj","paytoqs":"ignore","url":"http://192.168.0.2:61208/api/3/mem/percent","tls":"","persist":false,"proxy":"","authType":"","x":450,"y":60,"wires":[["5da80ee8.ca5c7","95aeb177.720b3"]]},{"id":"5da80ee8.ca5c7","type":"debug","z":"ffa42ff2.1cbe8","name":"Debug","active":true,"tosidebar":true,"console":false,"tostatus":false,"complete":"true","targetType":"full","statusVal":"","statusType":"auto","x":730,"y":60,"wires":[]},{"id":"4700babf.3febe4","type":"inject","z":"ffa42ff2.1cbe8","name":"Injection Polling Shedule","props":[{"p":"payload"},{"p":"topic","vt":"str"}],"repeat":"300","crontab":"","once":true,"onceDelay":0.1,"topic":"","payload":"","payloadType":"date","x":150,"y":60,"wires":[["9f303bf4.81a5f8"]]},{"id":"4d1a644a.4d78ec","type":"mios-out","z":"ffa42ff2.1cbe8","name":"Vera Virtual Device","server":"49dcbd80.e421e4","item":"WHS Mem Used %:CurrentLevel","x":350,"y":700,"wires":[]},{"id":"95aeb177.720b3","type":"function","z":"ffa42ff2.1cbe8","name":"Payload Code","func":"msg.headers = {};\nmsg.payload = {\"id\": \"variableset\",\n \"DeviceNum\": \"100\",\n\"serviceId\": \"urn:micasaverde-com:serviceId:GenericSensor1\",\n\"Variable\": \"CurrentLevel\",\n\"Value\": msg.payload.percent}\nreturn msg;","outputs":1,"noerr":0,"initialize":"","finalize":"","x":200,"y":120,"wires":[["2a23148.d3228ec"]]},{"id":"591b77d0.608d08","type":"debug","z":"ffa42ff2.1cbe8","name":"Debug","active":true,"tosidebar":true,"console":false,"tostatus":false,"complete":"true","targetType":"full","statusVal":"","statusType":"auto","x":730,"y":120,"wires":[]},{"id":"2a23148.d3228ec","type":"http request","z":"ffa42ff2.1cbe8","name":"HTTP Request to Vera Virtual Device","method":"GET","ret":"txt","paytoqs":"query","url":"http://192.168.0.248:3480/data_request","tls":"","persist":false,"proxy":"","authType":"","x":490,"y":120,"wires":[["591b77d0.608d08"]]},{"id":"a057986.53aca68","type":"http request","z":"ffa42ff2.1cbe8","name":"HTTP Request to Glances - CPU %","method":"GET","ret":"obj","paytoqs":"ignore","url":"http://192.168.0.2:61208/api/3/cpu/total","tls":"","persist":false,"proxy":"","authType":"","x":440,"y":180,"wires":[["1775d277.999e3e","389cd3.25fee32e"]]},{"id":"1775d277.999e3e","type":"debug","z":"ffa42ff2.1cbe8","name":"Debug","active":true,"tosidebar":true,"console":false,"tostatus":false,"complete":"true","targetType":"full","statusVal":"","statusType":"auto","x":730,"y":180,"wires":[]},{"id":"dc355f82.afc03","type":"inject","z":"ffa42ff2.1cbe8","name":"Injection Polling Shedule","props":[{"p":"payload"},{"p":"topic","vt":"str"}],"repeat":"300","crontab":"","once":true,"onceDelay":0.1,"topic":"","payload":"","payloadType":"date","x":150,"y":180,"wires":[["a057986.53aca68"]]},{"id":"389cd3.25fee32e","type":"function","z":"ffa42ff2.1cbe8","name":"Payload Code","func":"msg.headers = {};\nmsg.payload = {\"id\": \"variableset\",\n \"DeviceNum\": \"101\",\n\"serviceId\": \"urn:micasaverde-com:serviceId:GenericSensor1\",\n\"Variable\": \"CurrentLevel\",\n\"Value\": msg.payload.total}\nreturn msg;","outputs":1,"noerr":0,"initialize":"","finalize":"","x":200,"y":240,"wires":[["9059ff71.97ea5"]]},{"id":"28f555e6.0795ea","type":"debug","z":"ffa42ff2.1cbe8","name":"Debug","active":true,"tosidebar":true,"console":false,"tostatus":false,"complete":"true","targetType":"full","statusVal":"","statusType":"auto","x":730,"y":240,"wires":[]},{"id":"9059ff71.97ea5","type":"http request","z":"ffa42ff2.1cbe8","name":"HTTP Request to Vera Virtual Device","method":"GET","ret":"txt","paytoqs":"query","url":"http://192.168.0.248:3480/data_request","tls":"","persist":false,"proxy":"","authType":"","x":490,"y":240,"wires":[["28f555e6.0795ea"]]},{"id":"49dcbd80.e421e4","type":"mios-server","z":"","name":"Vera-Edge","host":"192.168.0.248","port":"3480"}]

I’ve installed InfluxDB and Grafana on my Raspberry Pi.
I’ve got Glances also installed on the Raspberry Pi and managed to connect glances hardware monitor from both the WHS and Raspberry Pi in to Grafana.

I’ve also got the VeraFlux plugin working and Vera sensor data is also now going to InfluxDB and Grafana.

I’ve discovered you cannot run the Glances hardware monitor in web GUI / JSON HTTP API mode and also export data to InfluxDB, its either one or the other.
So I have just installed the node-red node for InfluxDB, would be nice to be able to query the InfluxDB for say hardware monitoring my Windows file servers CPU Total % and Mem Used % and sending that value to a virtual device in Vera.
I can use a query like these:
SELECT total FROM “whs.cpu”
SELECT percent FROM “whs.mem”
They work and bring back a load of time stamps and the values at those times.
Not sure how to just pick out the last current values however and send it to a virtual device in Vera.

EDIT:
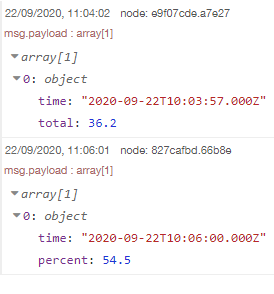
These queries work and only return one value:
SELECT total FROM “whs.cpu” ORDER BY time DESC LIMIT 1
SELECT percent FROM “whs.mem” ORDER BY time DESC LIMIT 1
However the time stamp doesn’t appear to be correct its 10:03:57 its now 11:03 am.
Also the function no longer works and passes the value to the virtual sensors in Vera.
I think it may need adjusting for the new data coming from InfluxDB rather than directly from the Glances HTTP API.

Thanks.
EDIT 2:
I’ve changed this line in the function node for the Mem Used %:
From this:
"Value": msg.payload.percent}
To this:
"Value": msg.payload[0].percent}
And for the CPU Total %:
From this:
"Value": msg.payload.total}
To this:
"Value": msg.payload[0].total}
Now it works and the virtual sensors in Vera are working again and showing a value.
I just need to figure out why the time stamp from InfluxDB is not quite right, its 1 hour behind.
The time on the Pi itself is correct:
date
Tue 22 Sep 11:19:43 BST 2020
Node-Red seems to be pulling back the Universal Time from the InfluxDB data, rather than British Summer Time (BST).
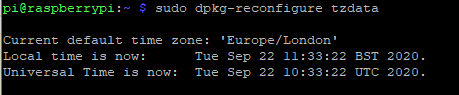
I don’t think it really matters if the timestamp is UTC rather than BST however.
Yes the time difference is gmt to bst, you could probably convert in the function or take a look at moments node , it is for working with times.